Introduction
Here’s a question worth answering before you read on. You’re running SGLang with chunked prefill on, which is the default. Fifty users are halfway through their replies. Someone pastes a long contract into a chat window and hits enter. While the server works through that contract, chunk by chunk, do the other fifty keep getting tokens?
We assumed they did. That’s what chunking is for, isn’t it? You cut the big prompt into pieces and let everyone else run in between. Then we read the scheduler, and for a typical deployment the answer is no. With the default settings, the fifty wait for the whole contract, just as they would without chunking.1 Chunking makes each step smaller. It doesn’t let their replies through.
This post is about that stall, and about its sibling: the KV cache filling up and the server pushing replies that are already under way back into the queue. Both make a fully busy GPU serve people badly. Both look fine in averages and terrible at p99. And they need different fixes, so the useful skill is telling them apart from your logs.
If you run an inference team and only read this far, ask four questions:
- Do we alert on tail time-to-first-token and inter-token latency, or just on throughput?
- Do we count retractions?
- Do our latency spikes line up with our longest prompts?
- Were our settings tuned for batch throughput, which is what most tuning advice targets, or for people waiting on a reply?
Everything below describes SGLang v0.5.20.2
One rule explains most of it
Every request runs in two phases. Prefill pushes the whole prompt through the model, usually in one forward pass. That is a lot of math for every weight loaded, so it tends to be compute-bound. Decode then writes the reply one token per forward pass. Each pass reads all the weights and the request’s cached keys and values to produce a single token, so it is mostly moving memory around. That’s why servers batch decode across many requests: read the weights once, use them for everyone.
SGLang rebuilds that batch on every scheduler iteration. Finished requests leave and new ones join. On each iteration the scheduler has to pick between starting new prompts and advancing the replies already in flight. Here is how it picks:
if new_batch is not None:
    # Run prefill first if possible
    ret = new_batch
else:
    # Run decode (skip for prefill-only batches)
    ...
That’s from get_next_batch_to_run in scheduler.py. On the default path, if there’s a prefill to do, it runs, and decode gets the GPU only when there isn’t one.
So what does chunked prefill buy?
Take the fifty users and the contract again, this time with chunking. --chunked-prefill-size caps how many prompt tokens go into one forward pass. If you don’t set it, SGLang usually picks from GPU memory: 2048 tokens below 20 GB, 4096 up to 60 GB, 8192 up to 160 GB, and 16384 above that. (Some model types and modes change or disable this, and DP attention divides it across ranks.) The contract gets split, and each chunk runs in its own pass, attending over the chunks already cached.
Now the next iteration comes around. Is there a prefill to do? While the contract is half-processed, the answer is yes. On the default path, the scheduler’s early exits from building a prefill batch all require that no chunked request is in progress. Here’s the first one:
if (
    running_batch.batch_is_full or len(self.waiting_queue) == 0
) and self.chunked_req is None:
    return None, running_batch
chunked_req is the half-finished contract. While it exists, a prefill batch gets built, and prefill runs first. So the fifty users wait for every chunk. The passes are shorter, but there are more of them, back to back, and no decode step runs in between.
What chunking does give you by default is a ceiling on the activation memory any single pass needs. That’s why SGLang’s own tuning guide reaches for it when prefill runs out of memory: drop the chunk size to 4096 or 2048, it says, which “saves memory but slows down the prefill speed for long prompts.” It’s a memory feature.
The latency feature is a different flag. With --enable-mixed-chunk, each prefill pass also carries one decode step for every running request, and those decode tokens count against the chunk’s token budget. Now the fifty users advance once per pass. The longest they wait between tokens is one chunk-sized pass, not the whole contract, and chunk size finally becomes the latency knob people expect it to be. There are catches. Mixing is skipped for the whole batch if any request in it asks for log probabilities, and SGLang turns the flag off at startup for several speculative-decoding modes.
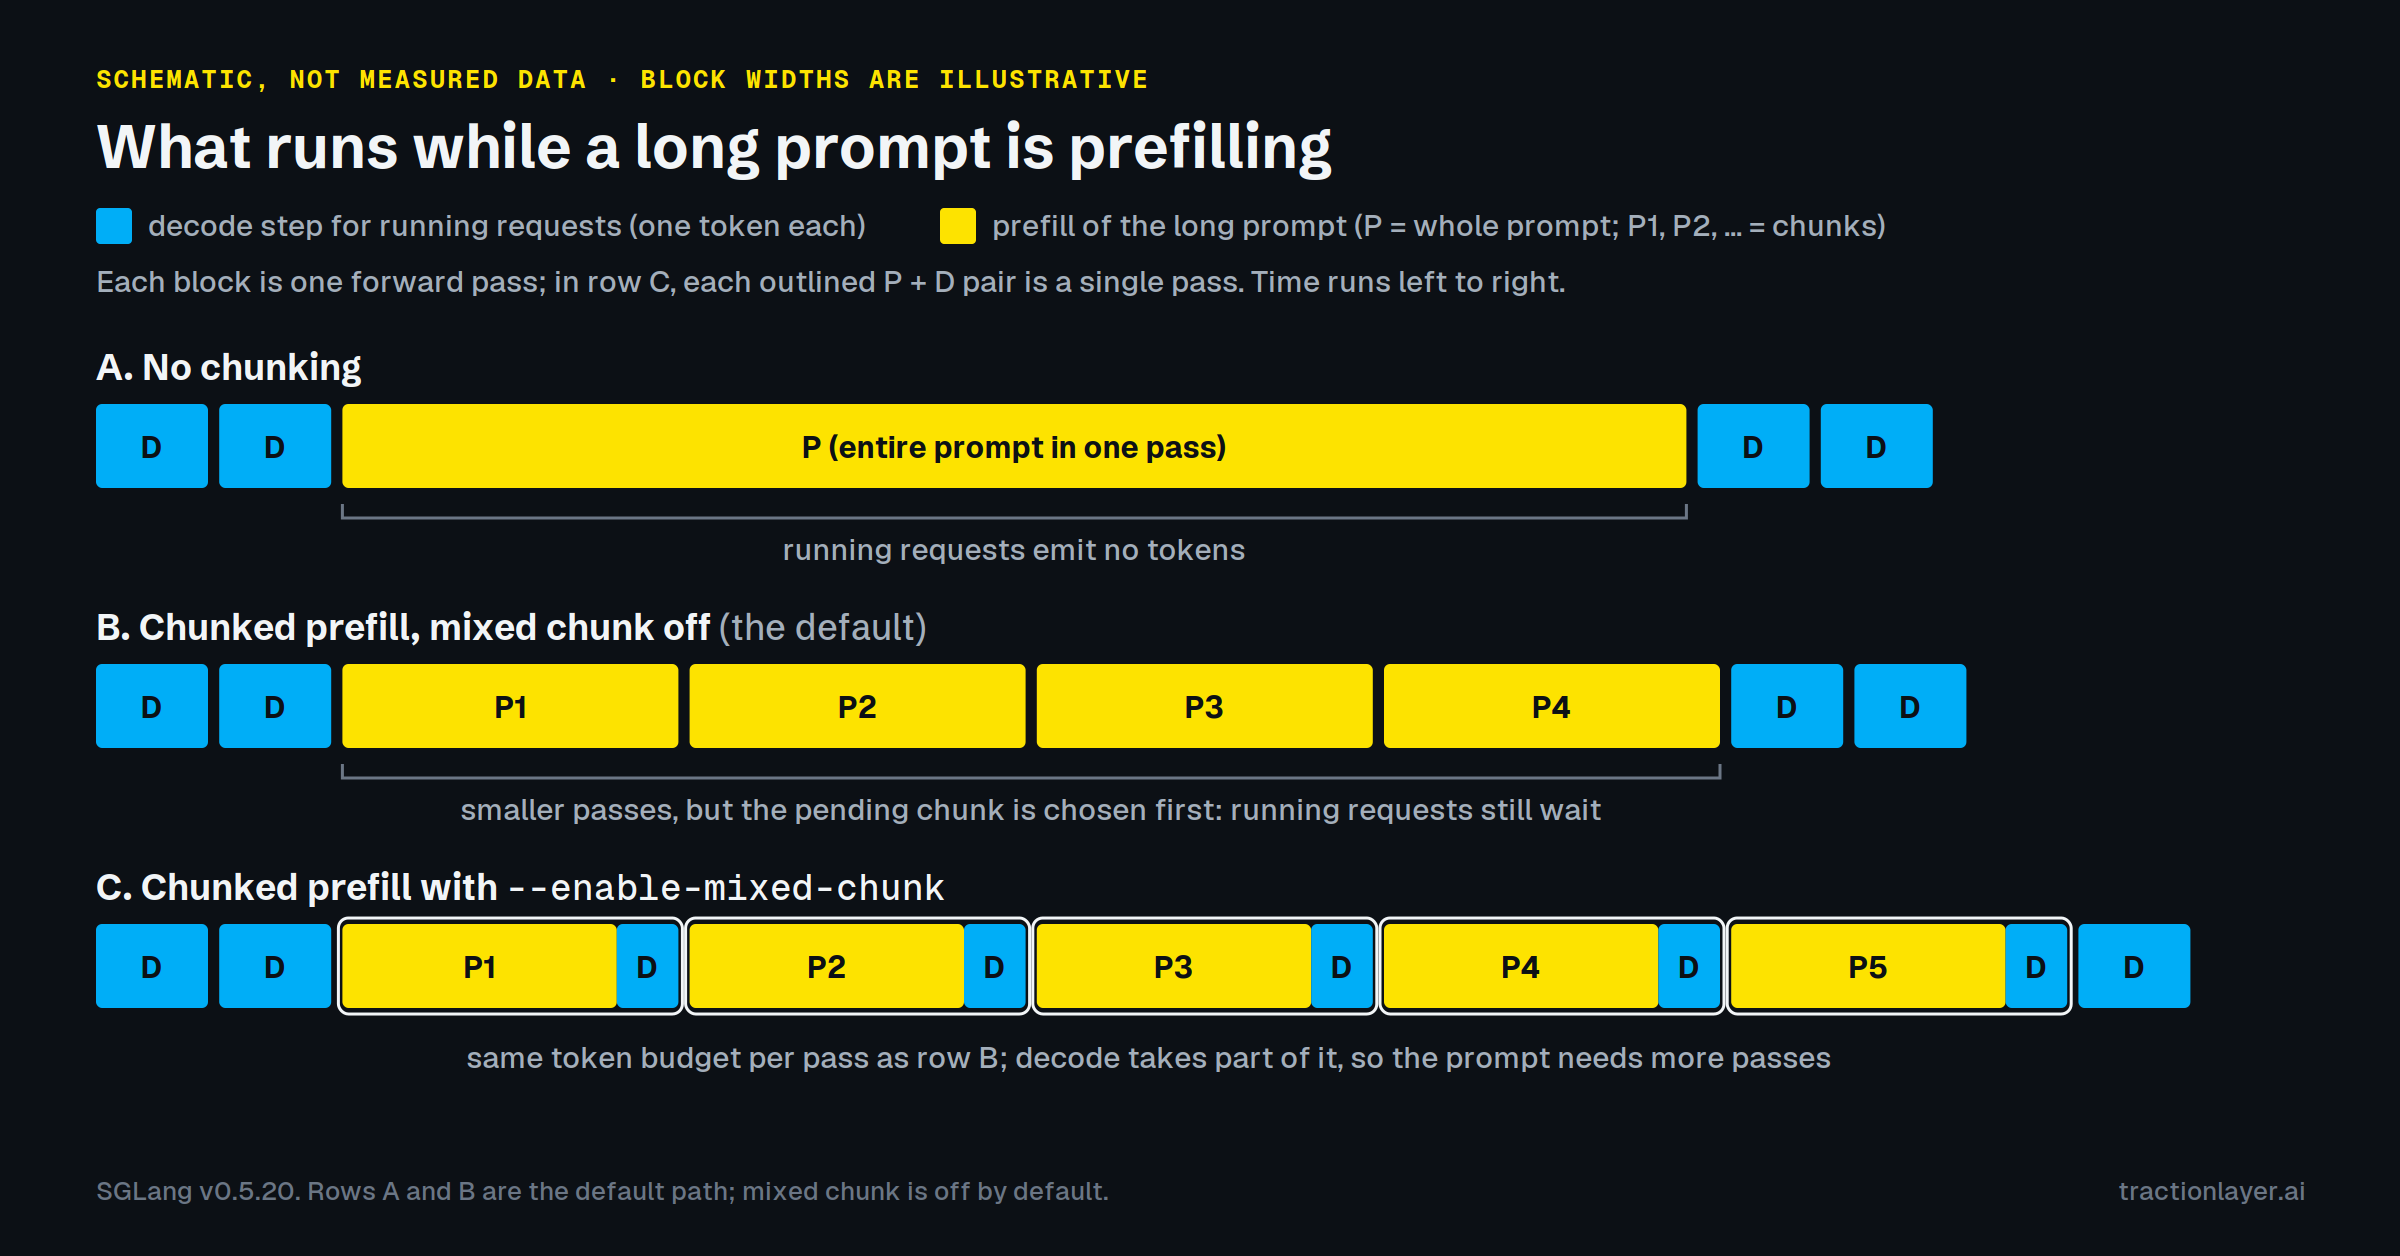
Mixed chunking has a price too. Decode tokens eat into each chunk’s budget, so the long prompt makes less progress per pass as the running batch grows, and its own first token arrives later. Smaller chunks mean more passes, each with fixed overhead. You’re trading one user’s time-to-first-token against everyone else’s inter-token latency, and where that balance lands depends on your model, your hardware and how long your prompts are. We’d be suspicious of anyone who quotes you a universal chunk size.
Two neighbors worth knowing about: --prefill-max-requests caps how many requests join one prefill batch (unlimited by default), and --prefill-decode-interval forces a number of decode rounds after each prefill batch. That second one is off by default, except for a profiled Qwen3-VL configuration on Hopper GPUs, where SGLang turns it on.
The other way to stall: running out of KV cache
The second failure has nothing to do with prompts arriving. It’s about memory running out halfway through replies.
Every token a request has seen lives in the KV cache, in every layer: a key vector and a value vector for each KV head. For standard attention, SGLang works out the cost per token, per GPU, as KV heads per GPU × (head_dim + v_head_dim) × layers × bytes per element.
Plug in Qwen2.5-7B-Instruct. Its config.json lists 28 layers, 28 attention heads, 4 KV heads and a hidden size of 3584, in bfloat16. There’s no head_dim in the config, so SGLang derives it as 3584 / 28 = 128. On one GPU with a BF16 cache:
4 KV heads × (128 + 128) × 28 layers × 2 bytes = 57,344 bytes ≈ 56 KiB per token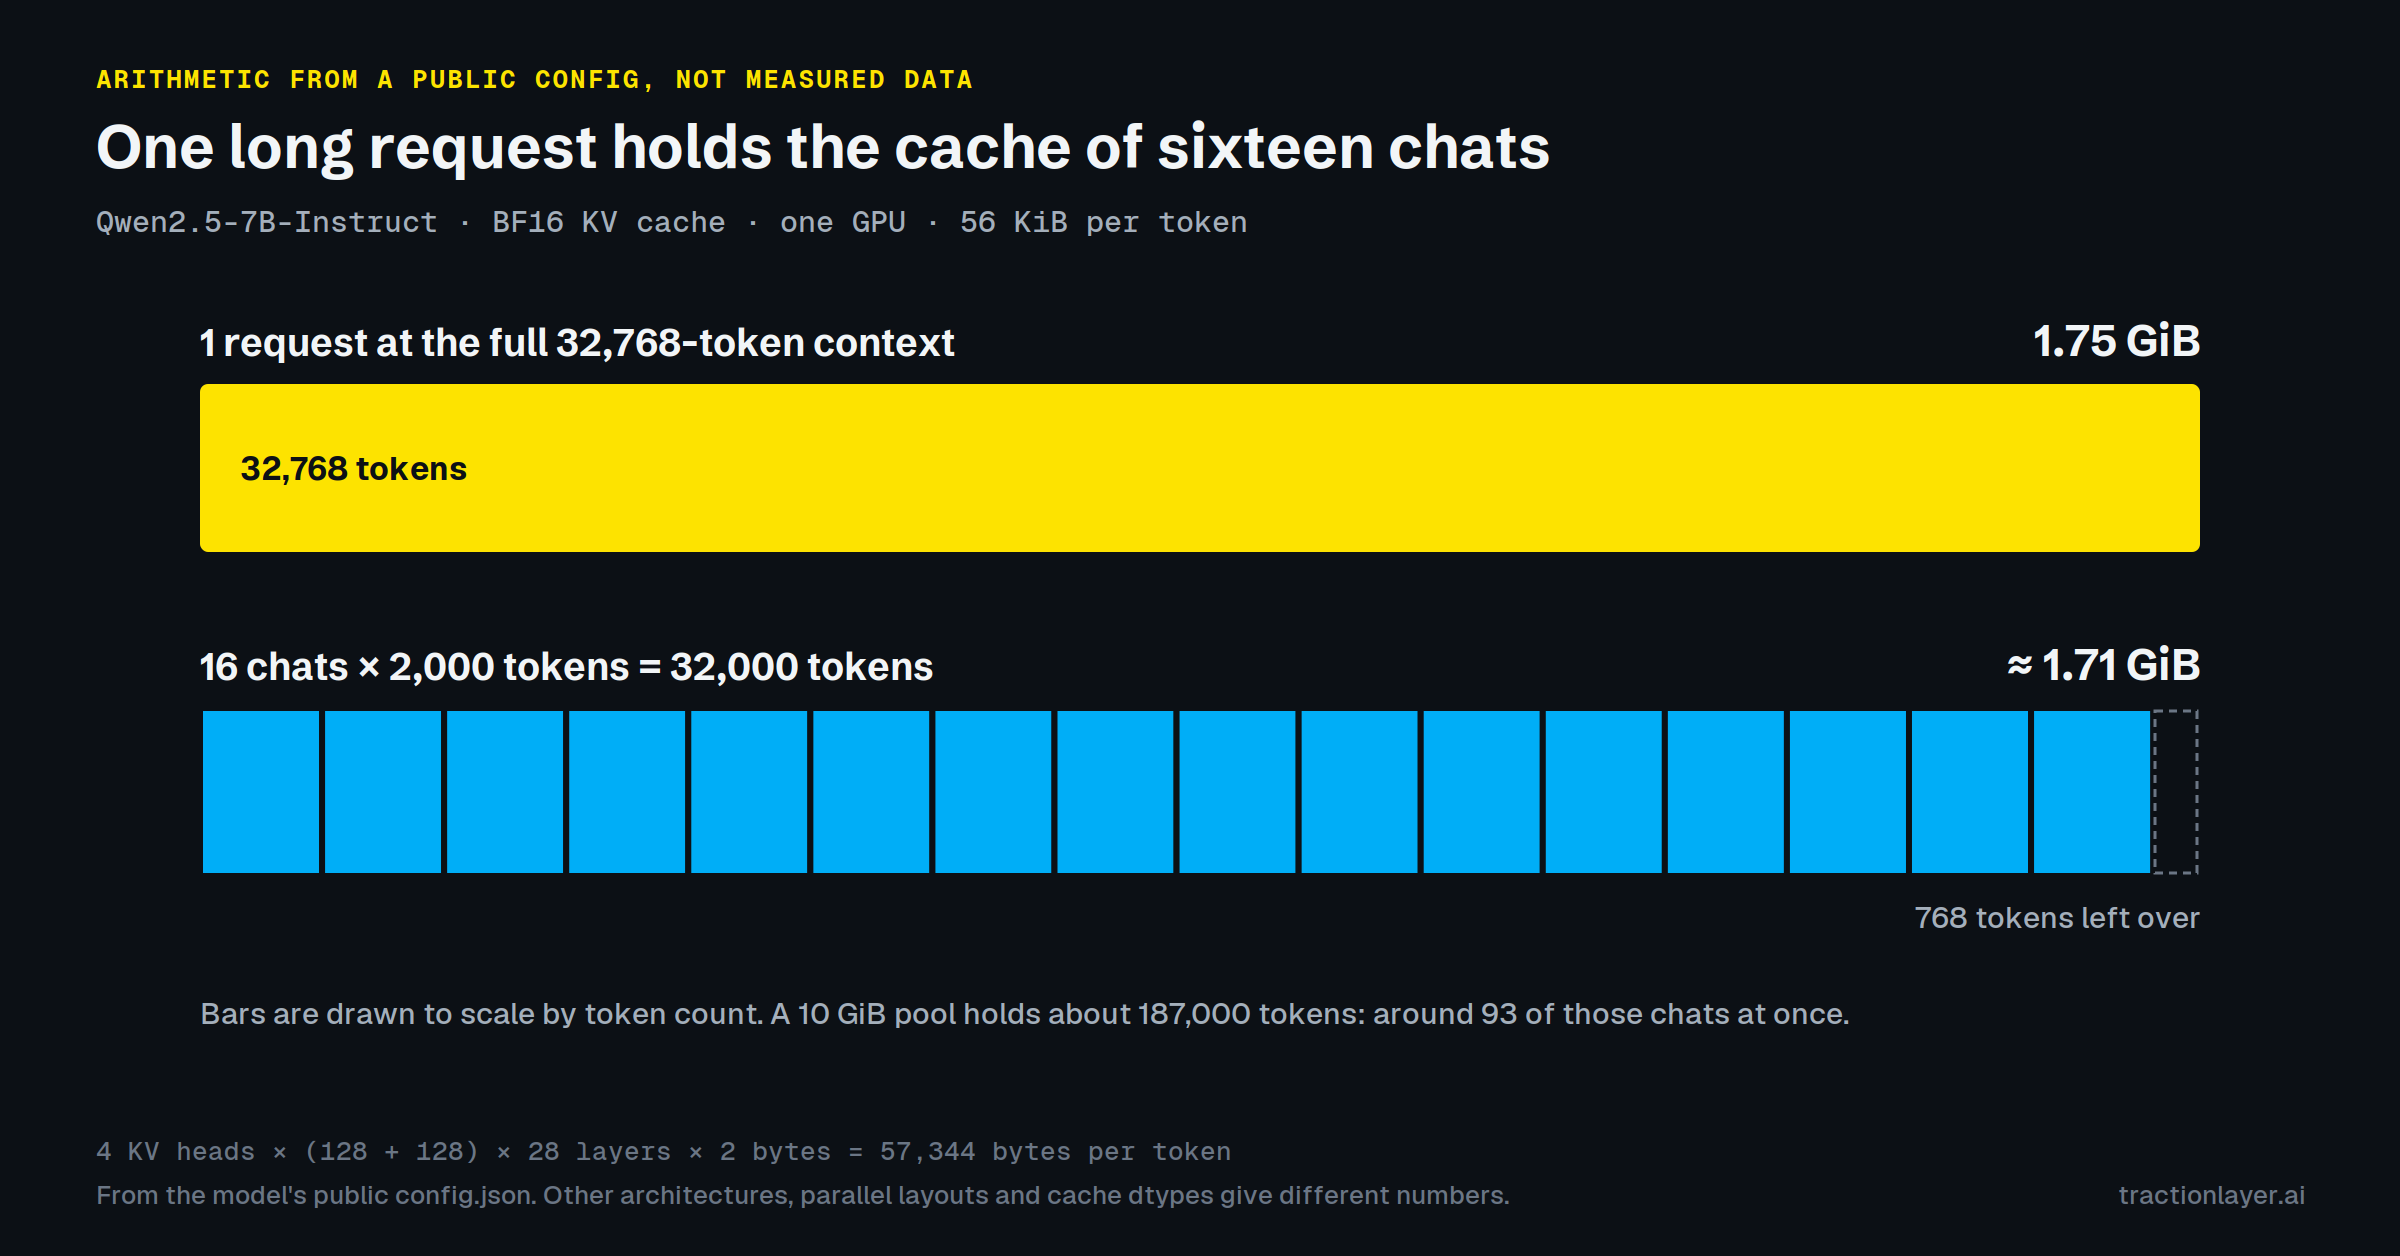
That doesn’t sound like much until you multiply it out. One request using the model’s full 32,768-token context holds 1.75 GiB. That’s as much cache as sixteen ordinary 2,000-token chats. A 10 GiB pool fits about 187,000 tokens, or around 93 of those ordinary chats at once.3 Split the model across two GPUs and each holds half the heads, so 28 KiB per token; an FP8 cache halves it again. Other architectures (MLA, sliding-window, state-space layers) do the arithmetic differently, so for your own deployment, read the number SGLang logs at startup:
max_total_num_tokens=..., chunked_prefill_size=..., max_prefill_tokens=...,
max_running_requests=..., context_len=..., available_gpu_mem=... GB
max_total_num_tokens is the size of your pool in tokens. available_gpu_mem is the GPU memory still free at that point, after weights, the cache and CUDA graphs. The tuning guide’s rule of thumb is that 5–8 GB left over is about right, and that 10–20 GB means you could give --mem-fraction-static more and grow the cache. Note the link back to chunking: a bigger chunk needs more activation headroom, and that headroom comes out of the cache.
The scheduler is guessing
When a request is admitted, nobody knows how long its reply will be. So the scheduler reserves a fraction of each running request’s remaining max_new_tokens and admits new work into whatever’s left. That fraction starts at 0.7 × --schedule-conservativeness (default 1.0), capped at 1. Every decode step without trouble, it decays a little, reaching 14% of where it started after 600 steps. The longer things go well, the more the scheduler packs in. It resets when the server goes fully idle.4
Sometimes the optimism doesn’t pay off. Before a decode step, the scheduler checks that the running batch has room for its next tokens. When it doesn’t, it retracts requests. It frees their KV memory on the spot and puts them back in the waiting queue, keeping the tokens they’ve already generated. By default it picks requests with short outputs and long inputs first. When a retracted request is readmitted, it recomputes whatever part of its cache is gone: at least the tokens it had generated, and the prompt too if that has since been evicted from the prefix cache. Then it carries on where it stopped. The log says:
KV cache pool is full. Retract requests. #retracted_reqs: N, #new_tokens_gained:
M, #new_token_ratio: X -> Y
and the scheduler resets its guess from what the running requests have actually generated.
SGLang’s tuning guide calls an occasional retraction, about one a minute, fine, and suggests raising --schedule-conservativeness to around 1.3 if they’re frequent. That advice is in a section titled “Achieving high throughput for offline batch inference,” and it makes sense there. If you’re serving people, each retraction is someone whose reply freezes mid-sentence until the server has room to rebuild its cache. How many of those you’ll tolerate is your call, not a number you can take from a throughput guide. (If you run DP attention, SGLang quietly multiplies your conservativeness setting by 0.3.)
Which one is it?
Both problems show up as bad tail latency. They leave different fingerprints.
The scheduler logs a decode line every 40 iterations:
Decode batch, #running-req: R, #token: T, token usage: U, cuda graph: ..., gen
throughput (token/s): ..., #queue-req: Q
token usage is how full the KV pool is. Tokens that sit only in the prefix cache and could be evicted don’t count, so a warm cache won’t make it look fuller than it is. If you serve a sliding-window model, you’ll see full token usage and swa token usage instead, one per pool, and either one can be the one that fills. Hybrid state-space models show full token usage and mamba usage. #queue-req is how many requests are waiting to get in.
Prefill passes log their own line, with #new-token saying how many prompt tokens went in.
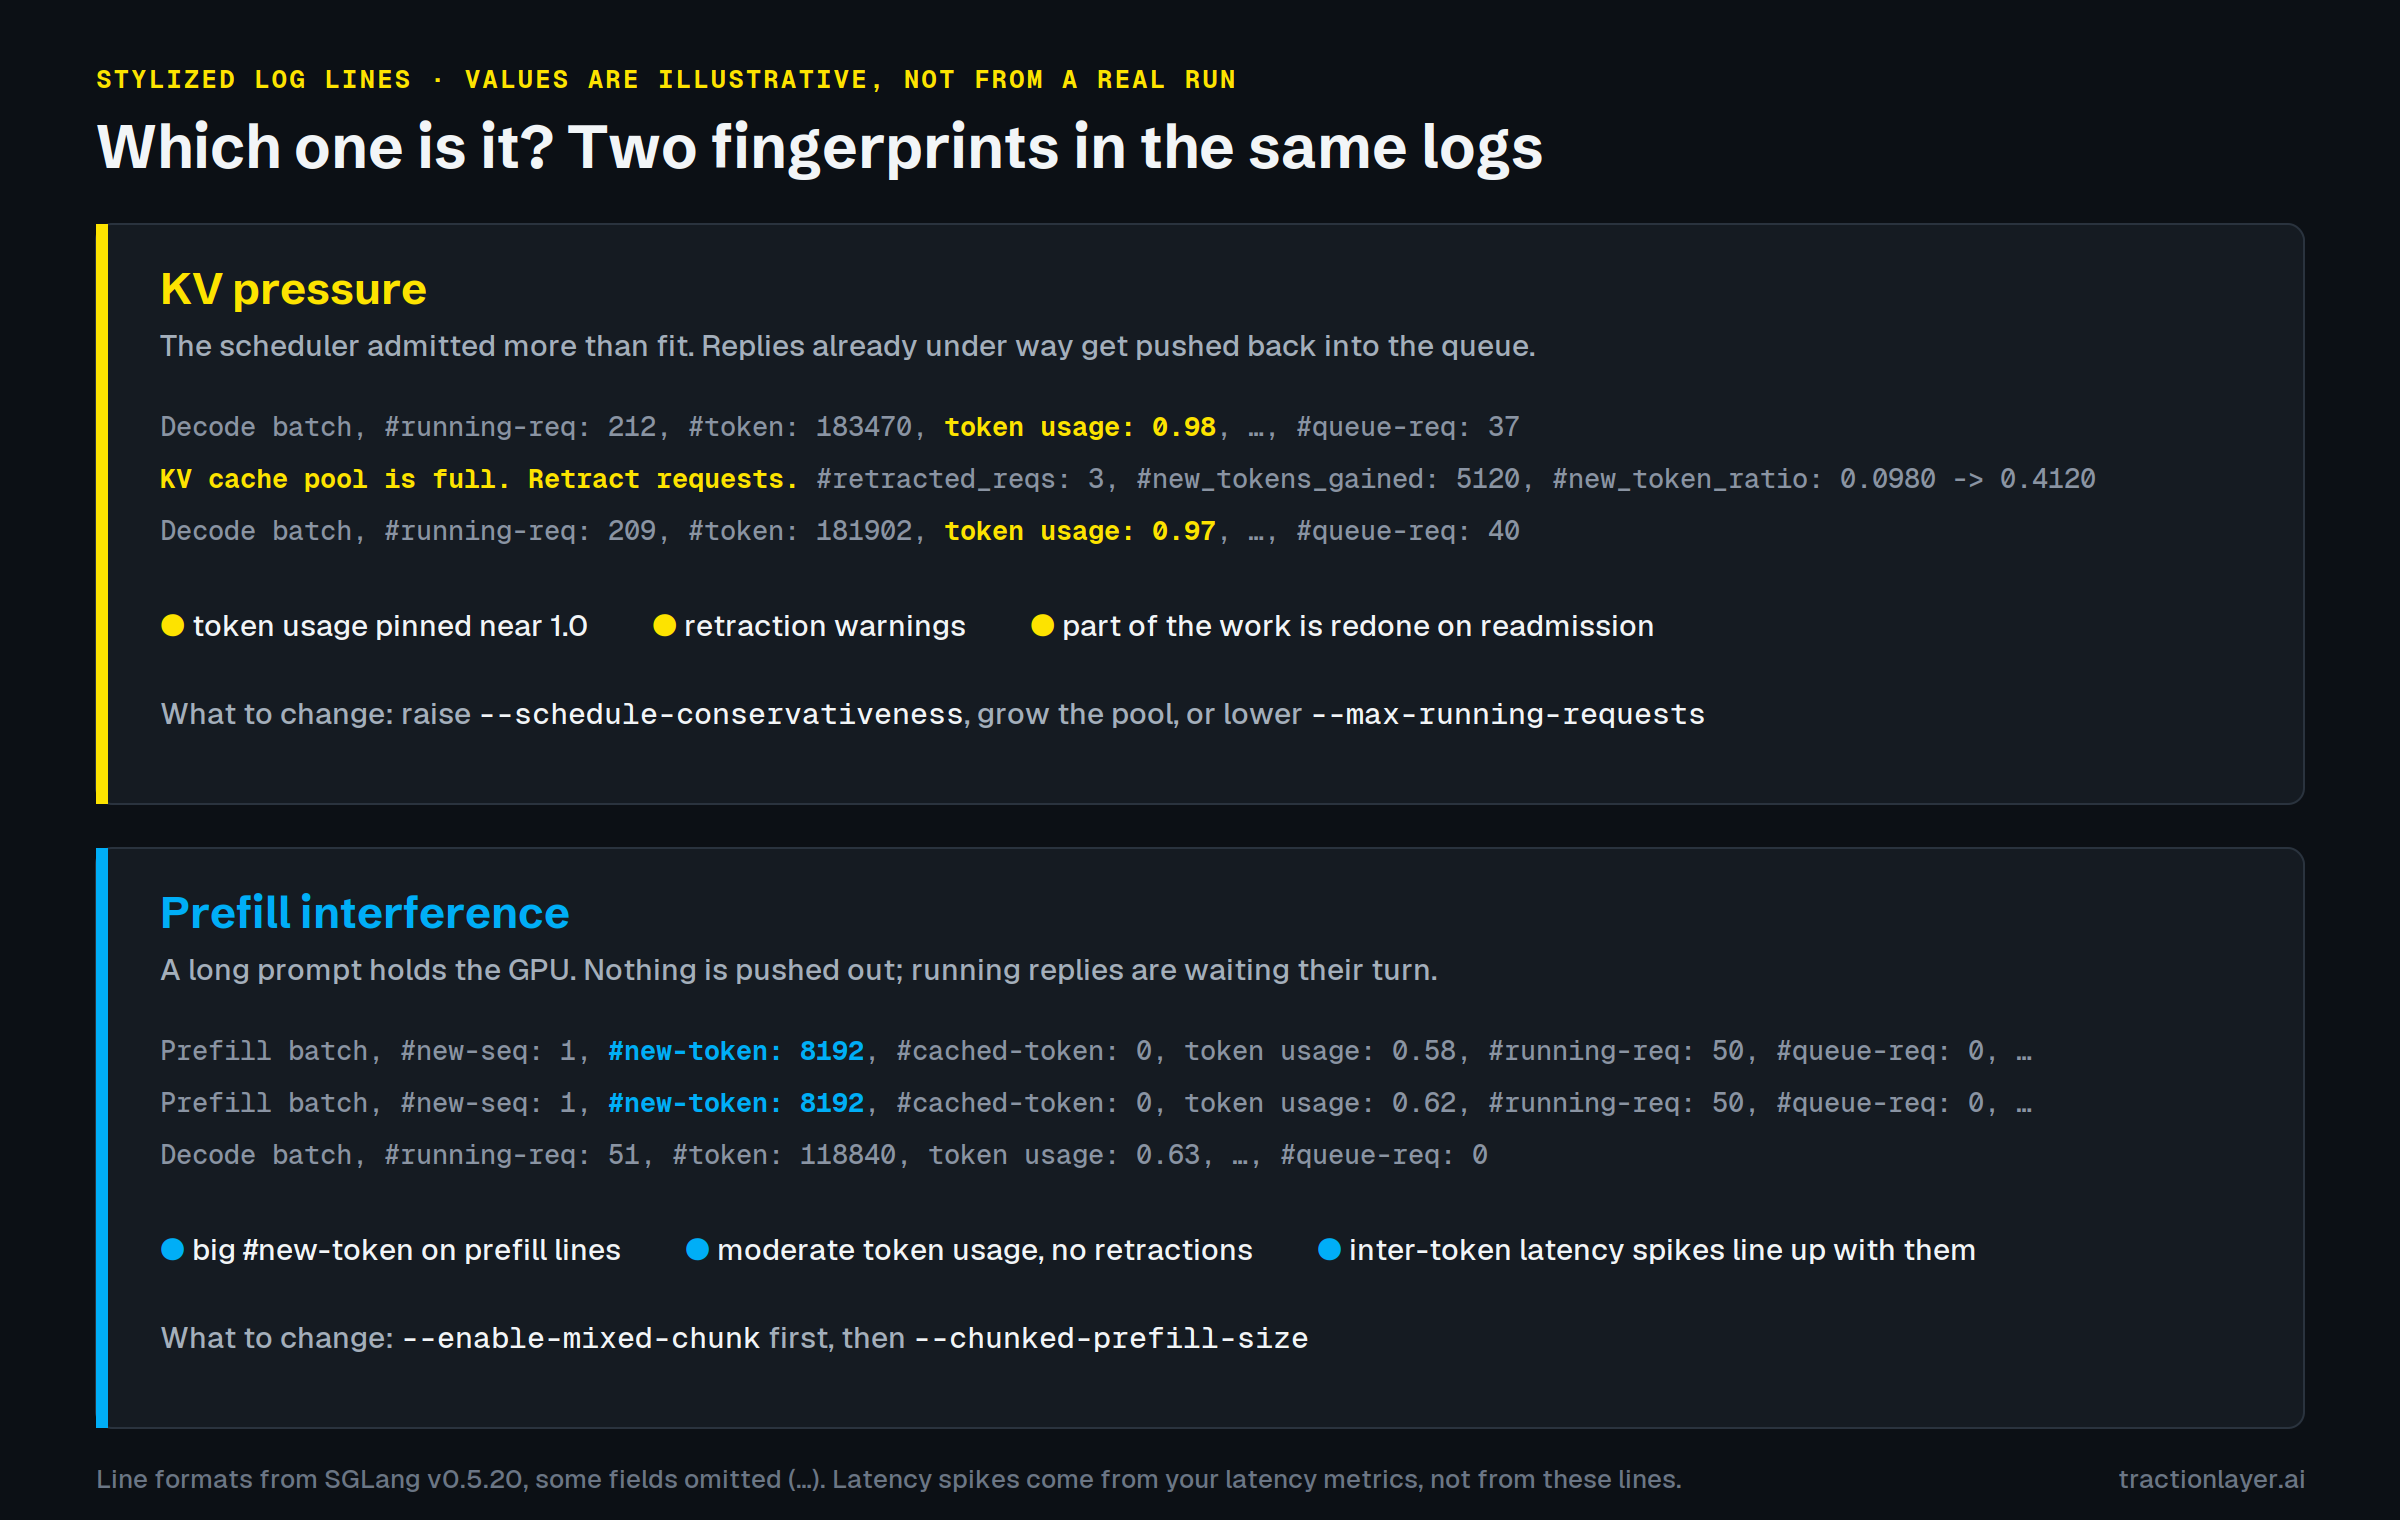
Put those together. KV pressure looks like token usage pinned near 1.0 and retraction warnings in the log. Requests are being pushed out and part of their work redone. Prefill interference looks like moderate token usage, no retractions, and inter-token latency spikes that line up with big #new-token values on prefill lines. Nothing is pushed out; people are just waiting their turn.
For dashboards, start the server with --enable-metrics. The series you want are sglang:num_running_reqs, sglang:num_queue_reqs, sglang:token_usage (on hybrid models it reports the fullest pool; sglang:full_token_usage and sglang:swa_token_usage break it out for sliding-window models), and the latency histograms sglang:time_to_first_token_seconds and sglang:inter_token_latency_seconds. For retractions, use the counter:
rate(sglang:num_retracted_requests_total[5m])There’s also a sglang:num_retracted_reqs gauge, but it’s overwritten on each retraction and reset to zero at the next stats report, so most scrapes miss it. The source has a note about maybe removing it.
Here’s all of that in one table:
| What you see | Probably | What to change |
|---|---|---|
| Retraction warnings, token usage near 1.0 | The scheduler admitted more than fit | Raise --schedule-conservativeness; grow the pool (--mem-fraction-static, FP8 cache, more GPUs); or lower --max-running-requests |
| Token usage under 0.9 with requests queued, for long stretches | The scheduler is too cautious, often because requests ask for a large max_new_tokens and stop early | Lower --schedule-conservativeness (the tuning guide suggests trying 0.3) |
#running-req stuck at the max_running_requests from the startup line | You’ve hit the running-request cap | Raise it if the KV pool has room; otherwise you’re at capacity |
| Inter-token latency spikes lined up with big prefill lines, no retractions | Prefill interference | --enable-mixed-chunk first, then --chunked-prefill-size |
| p99 TTFT climbing while decode looks fine and the queue grows | Arrivals near capacity | More capacity, or --max-queued-requests |
| The queue is always empty | You have headroom (or, in a benchmark, your load generator is the bottleneck) | Nothing |
| Out of memory during prefill | Too many tokens per pass | Smaller --chunked-prefill-size |
| Out of memory during decode | Too many requests at once | Lower --max-running-requests |
One warning about borrowing thresholds. The tuning guide calls token usage above 0.9 good and a queue of 100 to 2,000 requests healthy. For an offline batch job, it is: a deep queue keeps the GPU fed and nobody is watching any single request. For a chat product, a queue of 2,000 is 2,000 people staring at a spinner.
Why the median looks fine
Queueing behaves badly near capacity, and it’s worth seeing why. Little’s law says that, over the long run, the average number of requests in a system equals the arrival rate times the average time each one spends there.5 It holds for any stable system, whatever the traffic pattern, so it makes a good sanity check. At 20 requests a second and 6 seconds of mean latency, you should see about 120 requests in flight. #running-req plus #queue-req gets you most of the way, though it leaves out requests still being tokenized or in transit. If your dashboards say otherwise, they aren’t counting the same thing.
What Little’s law doesn’t tell you is how fast waiting time grows as you approach capacity. The textbook single-server queue with random arrivals and random service times (M/M/1) gives a feel for it: time in the system is 2× the bare service time at 50% utilization, 5× at 80%, 10× at 90% and 20× at 95%. An LLM server is not that queue, so don’t use those numbers. But the curve has the same shape, and the last few percent of utilization are where most of the waiting comes from.
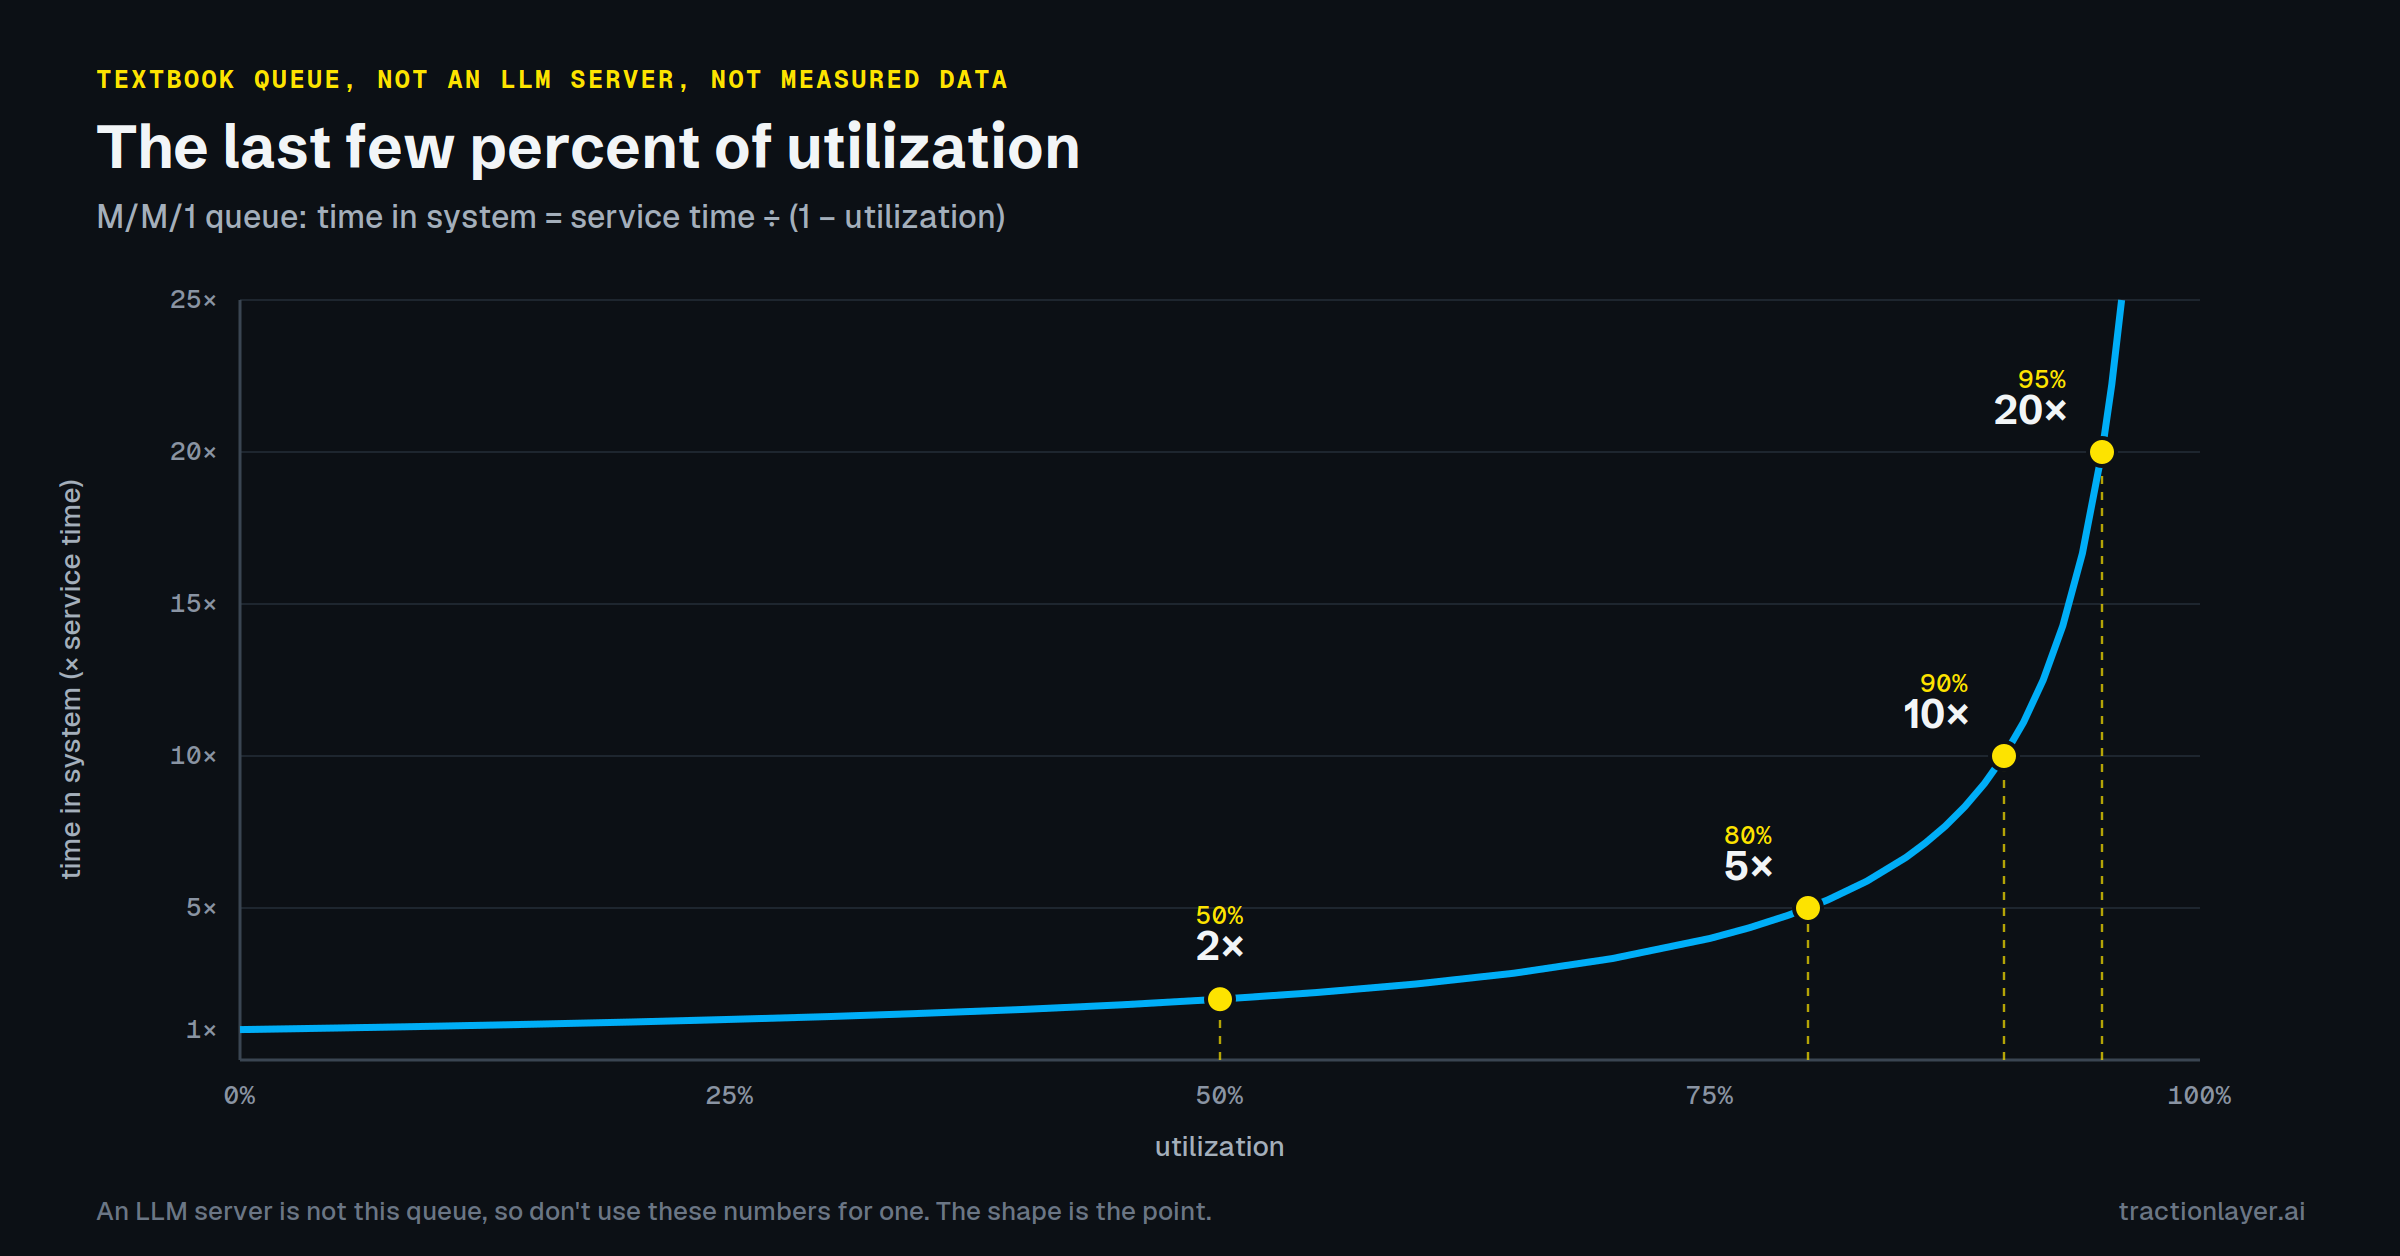
That’s also why median time-to-first-token lies. Under bursty traffic, most requests land on a short queue and wait only for their own prefill. The few that land in a burst wait behind it. The median describes the first group and p99 the second, and they can be very far apart while the dashboard looks green.
The tool for this is a queue limit. --max-queued-requests caps the waiting line. Past it, SGLang turns new requests away with “The request queue is full.” Non-streaming calls get an HTTP 503. Streaming calls get the error as an event inside the stream, so check what your load balancer can actually see before relying on it to retry. (With priority scheduling on, SGLang may drop a lower-priority queued request instead.) Turning work away sounds harsh, but a fast rejection lets a client or load balancer go elsewhere, and it keeps the requests you did accept on time. Little’s law tells you where to set it: a queue Q deep, drained at X requests per second, adds about Q/X seconds of waiting. (Don’t confuse it with --max-running-requests, which caps the decode batch, not the line.)
A word about tuners, including ours
All of this invites automation, and we build some of it. So here’s what we think you should demand from any tuner before it touches production.
It should tell you which signals it reads and which settings it moves. A tuner that adjusts chunk size from decode timing is working on prefill interference and is blind to KV pressure, and you should know that up front. It should check every change against a latency bound you care about, not just against its own objective, because an objective can improve while users suffer. Protecting the token rate of running requests can still let the queue grow forever. And it should keep a log you can read: what it saw, what it changed, what happened, and whether it backed out.
Traction Tuner adjusts two settings at runtime, chunked_prefill_size and prefill_max_requests. It reads the forward-pass metrics stream SGLang publishes, plus arrival counters that Traction Runtime, our hardened SGLang distribution, adds. Changing those two settings on a live server also needs Traction Runtime; stock SGLang v0.5.20 can’t change them without a restart. The tuner does not read KV-pressure signals yet, so it won’t help with retraction. It starts in observe-only mode, logging what it would change without changing it. With --apply, it lets each change settle for a window, then checks it against a guard that matches what the change was for, and reverts it if it did harm. If you set a value by hand, it notices and leaves that setting alone.
You’ll notice this post has no benchmark numbers. That’s deliberate. Every figure above is arithmetic from a public config, a default from SGLang’s source, a quote from SGLang’s documentation, or a textbook queueing result, so you can check all of it. When we publish measured results, they’ll come with the exact commands, hardware and versions behind them. Until then, the most useful thing you can do is look at your own Decode batch lines and see which of these two problems you have.
If you’d like a second pair of eyes on those lines, write to us at hello@tractionlayer.ai.
Notes
1. There are exceptions. --prefill-decode-interval forces decode rounds between prefill passes, and SGLang turns it on by default for one profiled Qwen3-VL setup on Hopper GPUs. Hybrid sliding-window models can also park a chunk when their token budget runs out, which lets decode run. With DP attention or pipeline parallelism, the picture is per scheduler and we haven’t traced it here.
2. Flags, log formats and metric names change between SGLang releases, so check them against the version you run. Traction Layer AI is not affiliated with, sponsored by or endorsed by the SGLang project.
3. The working, for anyone checking: 32,768 × 57,344 bytes = 1,879,048,192 bytes = 1.75 GiB. 10 × 230 / 57,344 ≈ 187,245 tokens. 187,245 / 2,000 ≈ 93.
4. The estimate per request is capped at 4,096 tokens, though a request can still generate up to its real max_new_tokens. The 0.7 starting point, the 600-step decay and the 14% floor are environment-variable defaults in v0.5.20.
5. J. D. C. Little, “A Proof for the Queuing Formula: L = λW,” Operations Research 9(3), 1961.
I’m an AI engineer at Traction Layer AI. I build Traction Runtime, our hardened SGLang distribution, and Traction Tuner, which is how I ended up reading SGLang’s scheduler closely enough to write this. If your logs tell a different story, I’d like to hear it: find me on LinkedIn or write to hello@tractionlayer.ai.